
Our clients

















Why TerraEye
There's always more ground than budget.
A single drill hole can cost more than a whole season of data, so committing to the wrong ground means the money is gone with nothing to show the board.
Finding anomalies is the easy part, because there are always plenty of them. The real question is which ones are worth testing on the ground, and that call stays yours, made with the evidence in front of you.


Faster field planning
What used to take four weeks of planning can take one, so the team reaches the right ground before the season closes.

Within your requirements
Evidence you can defend - Every target traces back to its source data and the physics behind it - evidence you can review.

Fewer false positives
Lay your satellite, geophysics and geochemistry over the same ground and see where the signals line up - so you chase fewer dead ends and spend the budget where the evidence agrees.
new in 2.0
TerraEye ranks targets on more than one line of evidence
TerraEye reads satellite imagery, geophysics and geochemistry in the same map view, so every target is checked against independent evidence before it moves to the field.
- 6,000+
- minerals in the library
- 3-in-1
- satellite, geophysics, geochem
- Auditable
- traceable to source data

new
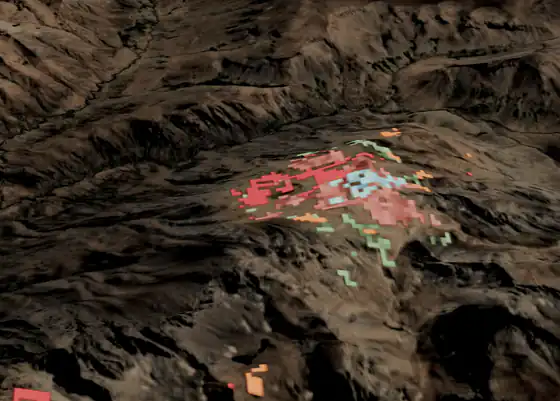
From flat maps to full 3D
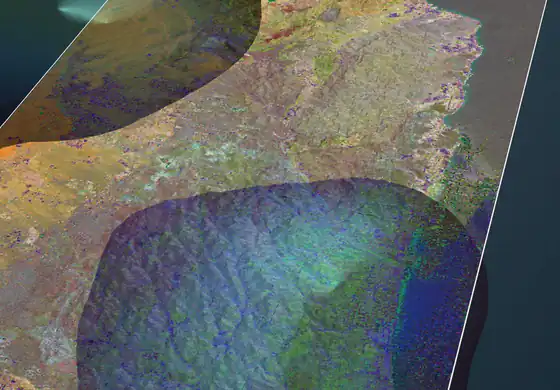
TerraEye is now a 3D platform. Flip any workspace from 2D to 3D and every layer, including the data you brought yourself, drapes over the real terrain.
New 3D engine
improved
More precise mineral matching
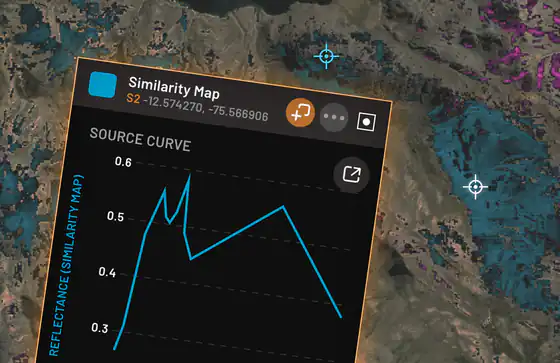
Mineral matching now runs on SFF, the most precise matcher in the platform, with SAM as a cross-check. You can display and compare spectral curves side by side, and in the Analogy Lab you can hunt for spectral analogues using pixels from deposits you know first-hand.
SFF · spectral curves · Analogy Lab
new
Beyond satellite, and greenfield-ready
Magnetics, gravimetry and geochemistry now sit beside your spectral layers. Starting a greenfield with nothing on file? TerraEye gathers the basics for you: Sentinel-2, ASTER and EMIT imagery plus global magnetics, gravity and topography, aggregated automatically for your area.
Multi-data workspace · automated greenfield setup
new
Ignacy got a team, and hands
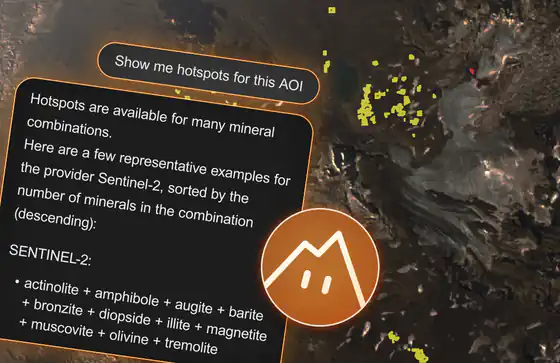
Ignacy, the in-app assistant, now manages a team of AI specialists: a geologist, a spectral geologist and a TerraEye guide. He also works the platform for you. Ask him to add layers, shift thresholds in bulk or swap one mineral hypothesis for another, and the map follows.
Ignacy · agent manager + AI team
new
Targets where the evidence overlaps
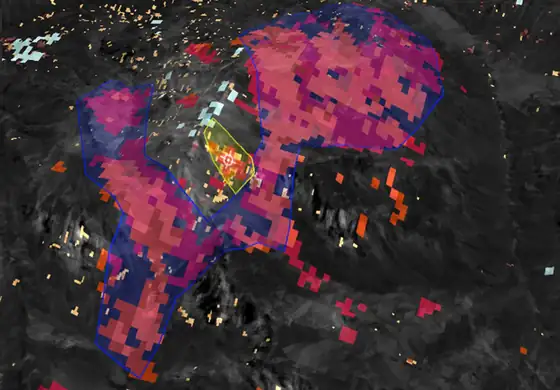
Bring your satellite, magnetics and geochemistry onto the same ground and stack them. Where independent layers light up in the same place, you have a target worth testing, and TerraEye keeps every layer registered, thresholded and ready to read.
Multi-layer targeting
new
Your workflow, always at hand
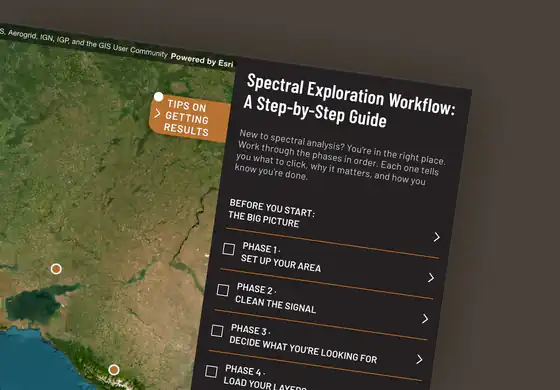
A right-side panel keeps the whole interpretation workflow open while you work: set up the area, clean the signal, load and tune the layers, validate, document. You always know where you are and what comes next.
Guided Exploration Workflow


How we work
Run it yourself, or have us run it for you.
Software
Work in the platform
Your team works directly in TerraEye: draw the area, pull the layers, run analyses and build your own interpretation - guided by the built-in workflow, with Ignacy at your side and a named geologist on call. Export to your GIS when you are done.
Best when your geologists are in-house.
Insights
Get the targets back
Our team runs the analysis for you: satellite first, with your geophysics, geology and geochemistry layered into the interpretation - and hands back a ranked set of targets with the evidence behind them, ready to take to your board.
Best when you would rather have the answer than build it.

how it works
See all your data in one view,
and let the targets stand out.
01
Load Your Data
Add your satellite, geophysics and geochemistry to a single workspace, instead of stitching the results together across five different tools and three consultants.
02
See Where They Overlap
When you line the datasets up, the picture gets clearer. A single anomaly might be noise, but when three of them land on the same ground, you have a target worth testing in the field.
03
Rank and defend your targets
You rank the targets; every one traces back to the satellite, geophysics and geochemistry behind it, in a form your qualified person can review and sign off on.
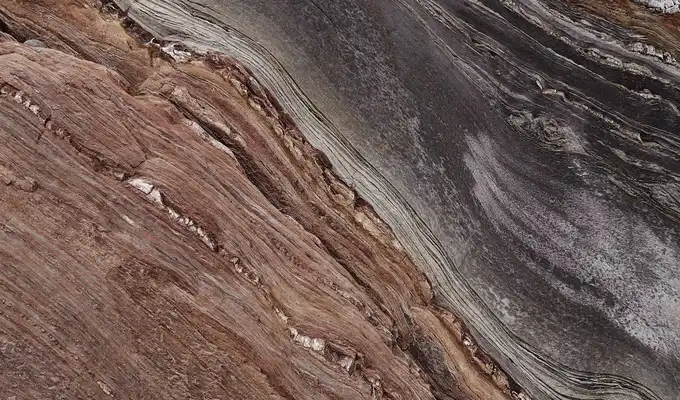
Chilean-Argentine Andes · Porphyry Cu-Mo Belt
El Perdido - Mineral Mapping Sample Report
TerraEye mapped alunite, muscovite and epidote across 3,208 km² of the Andean porphyry belt, then used one field sample of propylitic alteration to find every other area with the same signature.
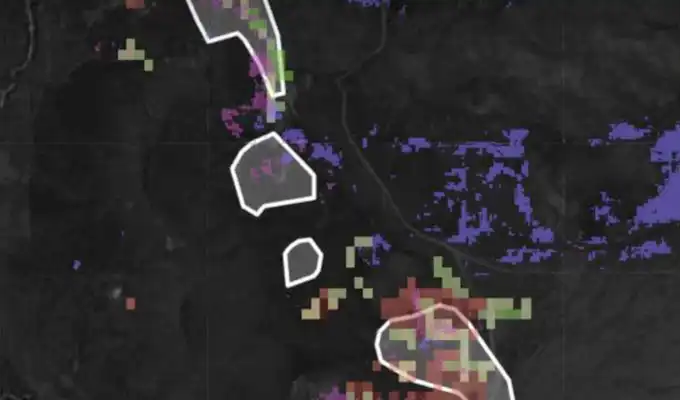
Chilean-Argentine Andes · Porphyry Cu-Mo Belt
El Perdido - Spectral Targeting Sample Report
Five classes of porphyry-related alteration mapped across 3,208 km², overlaid with interpreted structure and cut down by our geologists to 36 ranked targets covering 47 km².
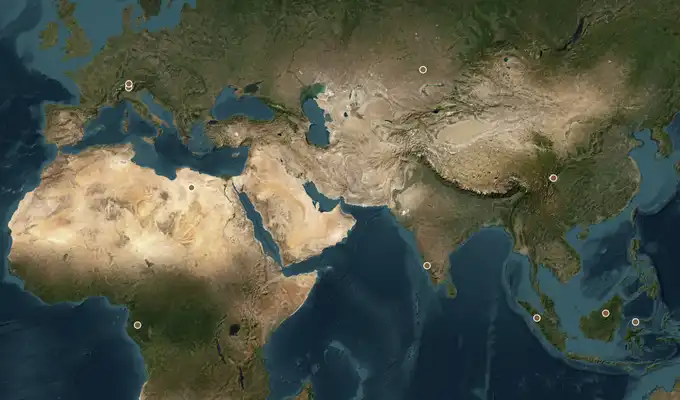
Three Areas · Two Continents
BMRC / IRH
Working entirely from orbit, TerraEye screened three exploration areas across two continents for BMRC/IRH and delivered 51 ranked targets, each with a documented evidence trail.
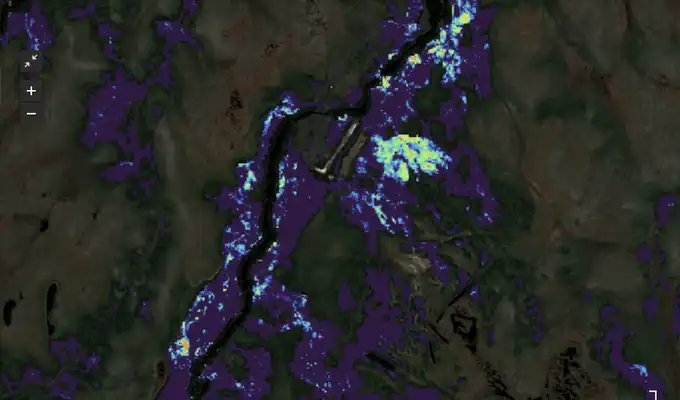
Red Dot 3D · Northern Ontario
Ring of Fire
We read the forest itself, picking up the stress that buried metals put on the vegetation from years of satellite imagery.


Read more about the above case studies and explore others. See all Case Studies →
Events
We’re heading to International Mining and Resources Conference (IMARC) 2026 in Sydney.
From 27 to 29 October, Magdalena Laban, Dr Wojciech Kuloza-Kaczan, Pablo Javier Echevarría and Paweł Leśko will be at ICC Sydney. We’d love to meet you and hear about your exploration projects, in Australia or elsewhere.
Events
Testimonials
Explorers who have put it to work.
Explainable
Defend your decision.
A lot of AI tools simply hand you a score and ask you to trust it. TerraEye shows the satellite, geophysics and geochemistry behind every target, in the form a qualified person needs to see, so it is the kind of call you can take to your board with confidence.
One workspace
Everything in one place,
instead of five.Rather than moving between separate tools and several consultants, you keep your satellite, geophysics and geochemistry together in one workspace where the layers actually work with each other. When you are done, you can export cleanly into the GIS you already use.


faq
Questions? We have answers.
Will this work on my ground?
Yes. The approach depends on your terrain, and difficult ground is something we work with regularly.
On well-exposed ground, we can map mineral signatures directly. With partial cover, we first mask interference such as snow, cloud, lichen, shadow, and seasonal vegetation, then analyse the exposed surface that remains.
In densely vegetated areas where some rock or soil is still visible, we combine spectral mapping of those exposures with vegetation analysis and your geophysics. For example, at Kuniko in Norway, our Bare Earth Composite identified exposed soil through forest cover, and subsequent soil sampling confirmed the iron mineralisation we had mapped.
Where there is no outcrop at all, we can use metal-stressed vegetation together with geophysics to look for indirect evidence of what is happening below the surface.
We also calibrate each project individually. Thresholds, sensor selection, and reference spectra are based on your ground rather than simply applying standard settings. Through the Analogy Lab, we can use spectral signatures from known deposits or occurrences on your project as references.
Before relying on the method on unknown ground, we can test it over an area you already understand. If we cannot reproduce what you already know is there, we will tell you.
Usually yes, but not from a single image. The first thing that happens is masking - separating what is rock from what is moss, lichen, canopy, snow and shadow. Get that wrong and everything downstream is noise, which is why we treat it as the foundation rather than a cleanup step.
On top of that, a Bare Earth Composite is built from years of archive imagery, selecting the passes where interference is lowest. At Kuniko in Norway that is how we found patches of exposed soil scattered through forest, and follow-up soil sampling confirmed iron mineralization where we had mapped it. Where the ground never opens up, we read the vegetation instead: metals in the soil put measurable stress on the plants above them, and that stress shows up across years of imagery. That is what we did in the Ring of Fire.
Where there is genuinely no surface expression, with mineralization sealed under thick transported cover, satellite will not see it. We will tell you that rather than sell you a study, and finding out costs you nothing: it is part of the free audit.
Mineral mapping reads how sunlight reflects off the ground: different minerals absorb and reflect in distinct patterns, and satellite sensors capture them. How precisely we can name a mineral depends on the sensor. Multispectral imagery like Sentinel-2 and ASTER captures a handful of broad bands. Hyperspectral like EnMAP, PRISMA and EMIT captures hundreds of narrow ones.
Mapped directly. Iron oxides and hydroxides such as hematite, goethite and jarosite read reliably even on multispectral, which makes it a fast way to cover large ground for gossans, leached caps and oxidised zones. Hyperspectral goes further and separates species that multispectral can only lump together: kaolinite from illite from muscovite, calcite from dolomite, one sulphate from another. That is the difference between flagging that alteration is present and mapping how it zones around a target.
Mapped indirectly. Some minerals have no usable feature of their own. Spodumene is the standard example: we map lepidolite and white mica zoning as the vector and leave the spodumene itself for ground truthing.
Not detectable. Sulphides such as pyrite, chalcopyrite, galena and sphalerite are spectrally featureless in the wavelengths these sensors measure, with few exceptions, and no amount of spectral resolution changes that. We infer them from the alteration halos around them. The same applies to any mineral present in too small a fraction of a pixel to separate from the rock around it.
These are limits of reflectance spectroscopy itself, not of processing power or better algorithms. Satellite data narrows down where the promising ground is. Sampling, geochemistry and drilling confirm what is in it, which is usually the sulphide you are actually after.
Send us your target list before you commit to anything and we will tell you which bucket each mineral falls into and which sensor would carry it. That is part of the free audit, so it costs you nothing, and it has talked people out of projects that would not have worked.
TerraEye can analyse areas from 25 km², but larger areas usually provide more value because satellite remote sensing benefits from regional context.
We support areas from 25 km² upward, and many clients work with projects around 40 to 50 km². For smaller areas, we select imagery suited to the specific question, such as WorldView-3 when spatial resolution matters, or EnMAP and PRISMA when greater spectral detail is needed.
In our experience, remote sensing delivers the most value across areas of 500 km² or more, where you can see geological structures and alteration patterns in their wider context.
We also often recommend analysing beyond the licence boundary. Geological structures and alteration systems do not stop at tenement boundaries. Looking at the surrounding ground can show where an alteration system is centred, which direction it extends, and whether the most prospective part lies inside or outside your licence.
What does this add to what I already do?
ASTER and LiDAR are a good starting point, but TerraEye adds more detailed mineral identification, newer imagery, better surface exposure, and the ability to combine remote sensing with your other exploration data.
ASTER’s six SWIR bands are useful for identifying broad mineral groups such as clays. Hyperspectral imagery from sensors such as EnMAP, PRISMA and EMIT can distinguish individual minerals, for example kaolinite from illite and muscovite, and even variations in white mica composition. ASTER also has an important limitation: its SWIR detector failed in 2008, so SWIR analysis is restricted to older archive imagery.
TerraEye also uses long-term Bare Earth Composites, selecting observations where each part of the ground is best exposed rather than relying on one satellite pass. This helps reduce problems caused by vegetation, snow, cloud and seasonal conditions. We also screen newer imagery from multiple satellite missions for quality.
The other difference is convergence. You can combine the spectral results with your LiDAR-derived structures, magnetics, geochemistry, geology and other data to identify areas where several independent lines of evidence point to the same target.
The analysis is also reproducible, so the same methodology can be rerun and compared over time.
If you already do multi-sensor hyperspectral analysis and long-archive compositing in-house, the main benefit may simply be speed. The easiest way to find out is to test TerraEye on an area you have already analysed and compare the results.
Nothing we do replaces any of that. TerraEye adds one more independent line of evidence to cross-check against it, over much larger areas and faster, carrying mineralogical and alteration information those datasets may not capture. It can confirm your existing targets, challenge them, or point to ground you had not been looking at.
Each pillar has its own reach. Geochemistry covers smaller areas and interpolates between sample points; spectral mapping is continuous. Geophysics reaches further but each method measures one parameter, and spectral response is another one to add to that stack. Structural work gains from satellite topography and spectral data together, which put lineaments in regional context rather than in isolation.
The biggest advantage is early, before the other datasets exist. Spectral coverage costs less, takes less time and is far less complicated than mobilising for geochemistry or a geophysical survey, which makes it the cheapest sensible first move on unworked ground. Later the value shifts to confidence: showing where spectral, geophysical, geochemical and structural evidence all land on the same ground.
Because alteration mapping depends on analyst judgement: which data to use, what thresholds to set, which reference spectra to match against. Different choices produce different maps, and those choices usually live in someone's head rather than in the report.
TerraEye makes them explicit and records the source data and parameters behind every layer. That makes the analysis reproducible: run the same methodology again and you can compare results directly, instead of starting over from another analyst's interpretation.
Neither. TerraEye is a tool for planning and prioritising your exploration program, not replacing geologists or fieldwork.
The platform handles the time-consuming remote sensing processing. Your team still interprets the results, ranks the targets, and makes the exploration decisions. The difference is that geologists spend less time processing raw data and more time working with actionable outputs.
Can I defend the results?
About 75 to 80% of mapped targets that clients have field-checked were confirmed.
Importantly, that is a mineralogical hit rate, not a discovery rate. If we map white mica, for example, fieldwork confirms whether white mica is actually present. Whether that alteration is associated with an economic deposit still requires geological interpretation, sampling, and drilling.
We also have independent field confirmations, including Kuniko in Norway, where soil sampling confirmed iron mineralisation in areas we mapped, published with EUSPA. At Umm Hadid in Saudi Arabia, our targeting led Kuya Silver to commission a second study on a different project.
They are a measure of spectral similarity. Mineral matching runs on Spectral Feature Fitting, with Spectral Angle Mapper as a cross-check, and the value tells you how closely that pixel’s spectral curve fits the reference curve for that mineral.
What it is not: not a concentration, not an abundance, not a probability that a deposit is present. A high value means the spectral evidence for that mineral at that pixel is strong. You can open the curves side by side and see what the number is based on.
Not as a single number, and that is deliberate. A lot of tools hand you one figure and ask you to trust it, which is exactly what a qualified person cannot sign off on.
Confidence here comes from agreement. Do independent methods point at the same pixels? Do different sensors? Does the signal hold when you move the threshold? Is it spatially coherent, or a scatter of isolated pixels? Do your magnetics and geochemistry land on the same ground? Every layer traces back to its source data, so the reasoning is open for your team to review rather than something you take on faith.
We reduce interference before mineral mapping begins.
TerraEye uses Sentinel-2 Bare Earth Composites to select observations with the best surface exposure and minimise cloud, snow, shadow, and water. Linear Spectral Unmixing helps separate vegetation, soil, and rock signals, while masking tools let users exclude remaining cloud, snow, vegetation, and water.
The outputs are then quality-checked by our analysts and geologists, particularly in areas with difficult surface conditions.
Both. Processing is automated, which enables fast turnaround. Results are delivered to the user automatically and are also reviewed by our Delivery team for quality control.
The methodology has also been independently validated in the field. For example, work with Kuniko in Norway was published with EUSPA, with soil sampling confirming mapped mineralisation. In the Ring of Fire, an independent team ranked our metal-stressed vegetation method the strongest predictor of high-grade nickel.
Working with the platform
Choose Software if your team wants to run the analysis themselves. You get the remote sensing tools, data layers, guided workflows, and expert support, while your geologists control the interpretation.
Choose Insights if you want TerraEye's team to do the analysis for you. We combine remote sensing with your geology, geophysics, and geochemistry and deliver ranked targets with the evidence and reasoning behind each one.
You can start with just an area of interest. TerraEye automatically assembles what is available for that ground: Sentinel-2, ASTER and EMIT imagery plus global magnetics, gravity and topography.
From there, you can analyse alteration, structure, and other signals together to identify areas of interest. The first pass helps you decide where more detailed exploration is worth your time and budget.
Yes. You can bring your own geophysics, geochemistry, and geological data into TerraEye and analyse it alongside the spectral layers in the same workspace.
From the Explorer plan, you can export results as georeferenced GeoTIFFs and GeoJSON vectors, with QGIS-ready styles and direct connections to QGIS and ArcGIS. If your workflow ends in your own GIS, start at Explorer.
Ground spectra can also be integrated, but currently with support from our team rather than through self-service upload. Raw satellite imagery cannot be exported due to data-provider licensing restrictions.
To get started, all we need is your area of interest as a GeoJSON.
If available, it helps to know the target deposit or mineral system and any known mineral occurrences that can be used as reference points.
You can also add geophysics, geochemistry, historical maps, field spectra, and other exploration data. But none of this is required. For a greenfield project, TerraEye can build the initial baseline from available data.
Getting started
In the platform, the first analytical outputs for a new area can be ready within hours, so you can usually start working the same day or the next.
A full Insights study typically takes several weeks, depending on the size of the area and the amount of data involved.
If you have an upcoming field season or mobilisation date, we can plan the delivery around it.
We can talk through your goals first and build the project and the budget around them.
Software plans have published pricing, so you can see where you land before speaking to anyone. Insights studies are scoped per project, sized to what the ground and the question actually require. For larger areas the cost per km² decreases.
Where teams have limited budget or want to see the method work first, we scope a single area, validate the results through ground truthing, and expand from there: more ground, more users, or a full study.
